
By Charles-Henry Monchau, chief investment officer, Syz Bank
US employment back to pre-covid levels, energy sector carrying the S&P 500 earnings growth, while Fed rate hike expectations rise again. Each week, the Syz investment team takes you through the last seven days in seven charts.
Chart #1 – Equity market rebound fuelled by expanding valuation multiples
The S&P 500 and the Nasdaq rose again this week despite a slight decline on Friday following the release of employment figures (see chart #5). Since its June 16 low, the S&P 500 has gained nearly 14%. Note that this summer rally is entirely due to an expansion of the P/E (blue line) since earnings expectations (orange line) have been revised downward (slightly). After having anticipated a clear deterioration of the macroeconomic situation during the first half of the year, with a sharp drop in the P/E multiple while earnings expectations were revised upwards, the market now seems to be expecting an improved outlook in the near future.

Source: Bloomberg
Chart #2 – Companies that report disappointing quarterly results aren’t being punished by the market
The quarterly earnings season is already well underway as 87% of S&P 500 companies have already reported their results. According to Factset’s statistics, 75% of companies beat market expectations for earnings per share, while 70% of companies reported revenues above expectations.
For the second quarter of 2022, the aggregate earnings growth rate for the S&P 500 Index was 6.7%. This is the lowest earnings growth rate recorded by the index since the fourth quarter of 2020 (4.0%).
An important point noted by Factset: the market is NOT punishing companies for reporting earnings below expectations. This is very different from the market’s behavior during the Q1 earnings call, when disappointing earnings were heavily punished by the market. As shown in the chart below for Q2 releases, companies that surpassed expectations saw their share price rise by an average of 2.1% (over a period that includes the two days before the release and the two days after). This figure is much higher than the 5-year average. Companies that announced earnings below expectations experienced no price change (0.0%) on average, a performance well above the 5-year average.

Source: Factset
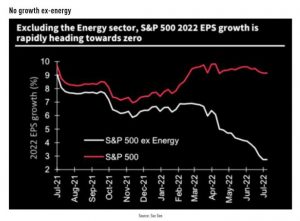
Chart #3 – Company results are very different when the energy sector is excluded
US earnings growth was one of the few bright spots in the first half of the year, as market expectations were gradually revised upward for many months. But as the chart from Société Générale shows, growth expectations have a very different pattern if we exclude the energy sector. While the market expects earnings per share growth of close to 9% in 2022 (red line), expectations outside the energy sector (white line) have been revised sharply downwards and are now close to zero.
Source: Soc Gen


