Schroders Chief Economist & Strategist Keith Wade looks back at how inflation responded in previous downturns to help gauge the scale of the adjustment in growth and unemployment needed to tame it this time around.
Since the last interest rate move by the Federal Reserve (Fed) on 27 July, investors have taken a more optimistic view of when the central bank can bring monetary tightening to a close. Markets are now pricing in a “Fed pivot” in late 2023, when the central bank is expected to cut interest rates.
Two factors have supported the move.
First, Fed chair Powell has said that US interest rates are now neutral, indicating that the initial adjustment from the ultra-easy pandemic policy is over and that future rate decisions will be taken on a meeting-by-meeting basis depending on the data.
Second, that data show the economy cooling as retail spending and housing slow. The latest GDP figures actually showed the US economy contracted in the first two quarters of the year and although they overstate the weakness of the economy, final demand clearly softened.
However, despite signs of slowdown the likelihood of a more pessimistic outcome on policy, where interest rates have to remain higher for longer, has significantly increased in our view. The obstacle to a Fed pivot is the high level of underlying inflation and the strength of the labour market, as evidenced by the latest employment report which showed a significant increase in payrolls and a further fall in unemployment.
An analysis of past cycles shows that it would be a rare achievement for an economy which is so late in its cycle to bring inflation back to target without a fall in activity, or an outright recession. In our view it would be better if the Fed took a leaf out of the Bank of England’s playbook and acknowledged this, rather than projecting soft landings.
Cycles and inflation: a look back
At the peak
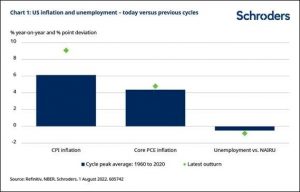
The rapid rebound in the US since the economy reopened from Covid restrictions last year has taken activity above its long-run trend, as evidenced by a tight labour market and high capacity utilisation rates in industry. At 3.5% the unemployment rate is well below estimates of equilibrium, or the Non-Accelerating Inflation Rate of Unemployment (NAIRU) (the lowest level of unemployment that can occur in the economy before inflation starts to rise). The Congressional Budget Office (CBO) put this at 4.4% in the second quarter.
Meanwhile, CPI inflation has risen to 9.1%, its highest level for 40 years. Relative to previous peaks since 1960, the current position compares with an average CPI inflation rate of 6.1% and an unemployment rate 0.5% below the NAIRU (chart 1).
The US is clearly late in its cycle and as signs of slower growth come through, we would argue that the economy probably reached a peak relative to trend in the current quarter.
How much of a slowdown in activity is needed to bring inflation down?
To help answer this we have looked back at previous peaks in the cycle to gauge the effect of the subsequent contraction in output on unemployment and inflation. According to the NBER, there have been nine previous occasions since 1960 where the economy has been at a peak. In each case the economy then went into recession, before troughing out several months later. The last such contraction took place between February and April 2020 – the shortest recession on record.
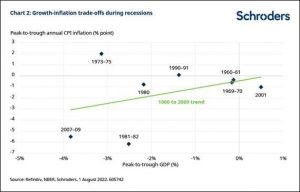
Prior contractions in the US since 1960 have lasted between six and 18 months and are more typical of what we might expect going forward. Looking at those eight cycles, the average fall in GDP was 1.6% from peak to trough and the unemployment rate rose by 2.5 percentage points (pp), moving from below to above the NAIRU. On the CPI measure, inflation fell by 1.5 pp on average.
There was a wide range of experience, with inflation falling by more than average during the “Great Recession” of 2007-09 and the second “Volcker” recession of 1981-82, when GDP fell 3.8% and 2.5% and inflation by 5.5 and 6.2 pp respectively. The worst outcome in terms of the growth-inflation trade-off was 1973-75 when, despite a contraction of 3.1% in GDP, inflation actually rose 2%, a severe case of stagflation (see chart 2).
So how does this relate to the current position? So far, we have seen that a significant fall in GDP has been needed to bring a major fall in inflation. For example, a 6 pp fall in CPI inflation from current levels to 3% would require a decline in GDP of just over 3 pp based on the two major recessions mentioned above. In terms of the impact on jobs, the unemployment rate would rise by around 4 pp to 7½%.