The S&P 500 is the most important US equity index which provides exposure to the largest US companies. It is considered around the globe as a barometer of US stock market performance. The index is market-cap weighted and it covers approximately 80% of available US equity market capitalization. The largest members of the index are household names such as Apple, Microsoft, Amazon, Nvidia and Alphabet. The index therefore reflects and captures the strength of the US economy and in recent decades has benefited from the rise of US technology stocks.
The S&P 500 index has provided an average annual return of +12.16% over the past decade, which has placed it ahead of equity performance of other regions. For example, UK stocks captured by the FTSE 100 index had an average annual return of +3.33% in the same period, while European stock portfolio (represented by the MSCI Europe index) had an average annual return of +4.97%. With this solid performance, US stocks have grown to represent a 63% share in the global stock universe; today it is easily the single most important component of a diversified investment portfolio. To put it into perspective, UK stocks currently account for 3.5% of the global stock market.
Market access with ETFs
The easiest way to gain exposure to the S&P 500 portfolio is via an Exchange Traded Fund (ETF). ETFs can be used as convenient and cost-effective building blocks in constructing a globally diversified portfolio. An investor can increase or reduce positions in an ETF at any time by trading on an exchange such as the London Stock Exchange (LSE).
S&P 500 with a sustainability overlay
A growing number of investors are considering Environmental, Social and Governance (ESG) factors in their investment process. Attaining exposure to well-known indices such as the S&P 500 with added ESG screening has gained traction with investors driven by its improved sustainability profile and comparable risk-return characteristics to the parent index. The UBS S&P 500 ESG UCITS ETF is an example of a passive fund which provides a sustainable alternative to standard S&P 500 exposures.
S&P 500 ESG
The underlying S&P 500 ESG index is designed to offer broad market representation and can be viewed as a core building block with a sustainability overlay. From an ESG perspective, it applies business-activity exclusions that are deemed essential (so, companies involved in controversial and military weapons, small arms, tobacco, oil sands and thermal coal are excluded) and it removes companies involved in serious violations of the UN Global Compact Principles. Furthermore, it divests from companies with lackluster sustainability profiles, e.g. companies that are in the bottom quartile by ESG-score within their respective sector. With this construction, the S&P 500 ESG index comprises of approximately 320 stocks, which are broadly diversified across sectors. This ESG portfolio therefore maintains risk and return properties close to that of the standard S&P 500, while exhibiting an improved ESG profile and lower carbon footprint as compared to the parent index.
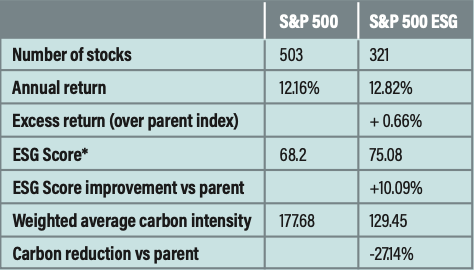
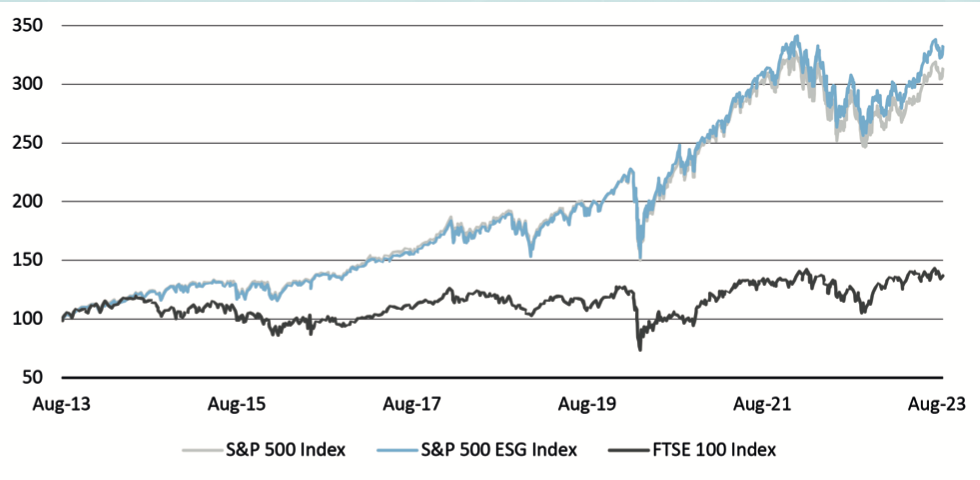
Since the fund’s inception in March 2019, the UBS S&P 500 ESG UCITS ETF has outperformed the S&P 500 ESG Index by 14 bps per annum due to reduced dividend taxation and exceeded returns of the standard S&P 500 Index by 201 bps per annum (Figure 1). Over the past decade, the S&P 500 ESG Index has outperformed the flagship S&P 500 index (Figure 2) providing excess returns of 66 bps per annum (Table 1). The ETF supports investors in aligning their investment strategy not only with their financial goals, but also with their sustainability views and objectives. The ESG score improvement (vs the parent index) of the S&P 500 ESG Index is improved by 10.09% while the weighted average carbon intensity has been reduced by 27.14% relative to the parent index.

Table 1: Metrics and performance of S&P 500 ESG vs S&P 500 parent index (August 2013 – August 2023)
Conclusions
Over the last decade the US market as represented by S&P 500 Index outperformed the FTSE 100 and other UK stock indices.
The UBS S&P 500 ESG ETF enables investors to access the US market and provides a sustainable alternative to the core S&P 500 exposure whilst exhibiting a similar risk-return profile. In addition, the S&P 500 ESG ETF provided positive excess returns compared to S&P 500 index since its launch, while providing a better sustainability and carbon profile.
Figure 2: Performance of S&P 500 Index, S&P 500 ESG Index and UK FTSE 100 Index
Source: S&P Global, USB Asset Management. Data as of 31 August 2023. ESG Score as of 30 June 2023. Includes backtested data. Past performance whether simulated or actual is not a reliable indicator of future returns.
S&P 500 ESG Elite
An investor with more pronounced ESG objectives may consider another fund (USB S&P 500 ESG Elite ETF), which tracks the S&P 500 ESG Elite Index. This index applies a broader set of business activity exclusions and follows a best-in-class approach, i.e. selecting only the top 25% of companies with the highest ESG scores in each sector, which clearly provides for a stronger sustainability profile. The resulting improvement in ESG score is 33.37% (June 2023) and the weighted average carbon intensity was lowered by 35.13% (August 2023) compared to parent index.
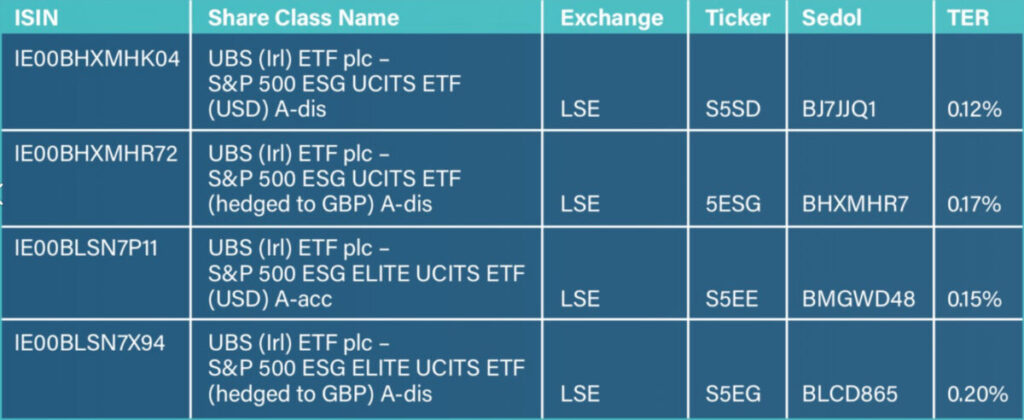
UBS S&P 500 ESG and UBS S&P 500 ESG Elite information
ETF Opportunities and risks
Opportunities:
- The investment objective is to replicate the price and return performance of the sub-fund’s index net of fees.
- The fund generally invests in stocks contained in the index. The relative weightings of the companies correspond to their weightings in the index.
- The fund is passively managed.
- The product described herein aligns to Article B of Relegation (EU) 2019/2066
- Clients benefit from the flexibility of an exchange-traded investment.
- Provides access to the performance of the index with a single transaction.
- Optimized risk/return profile thanks to a broad diversification across a range of countries and sectors.
- The fund offers a high degree of transparency and cost efficiency.
- UCITS compliant fund.
Risks:
- The UBS Exchange Traded Fund invests in equities and may therefore be subject to high fluctuations in value.
- For this reason, an investment horizon of at least five years and corresponding risk tolerance and capacity are required.
- All investments are subject to market fluctuations.
- Sustainability characteristics and risks are considered as part of the index selection process.
- Every fund has specific risks, which may significantly increase under unusual market conditions.
- Changes in currency exchange rates may have an impact on fund value.
- The fund’s assets are passively managed. As a result, the new asset value of the fund is directly dependant on the performance of the underlying index. Losses that could be avoided via active management will not be offset.
For more information on UBS, click here
For marketing and information purposes by UBS.
For professional clients only. UBS funds under Irish law.
Arrangements for marketing fund units mentioned in this document may be terminated at the initiative of the management company of the fund(s).
The benchmark is the intellectual property of the index provider. The Share Class is not sponsored or endorsed by the index provider. Please refer to the Fund’s prospectus or supplement for the full disclaimer.
Before investing in a product please read the latest prospectus and key investor information document carefully and thoroughly.
Any decision to invest should take into account all the characteristics or objectives of the fund as described in its prospectus, or similar legal documentation. Investors are acquiring units or shares in a fund, and not in a given underlying asset such as building or shares of a company. The information and opinions contained in this document have been compiled or arrived at based upon information obtained from sources believed to be reliable and in good faith, but is not guaranteed as being accurate, nor is it a complete statement or summary of the securities, markets or developments referred to in the document. Members of the UBS Group may have a position in and may make a purchase and / or sale of any of the securities or other financial instruments mentioned in this document. Units of UBS funds mentioned herein may not be eligible for sale in all jurisdictions or to certain categories of investors and may not be offered, sold or delivered in the United States. The information mentioned herein is not intended to be construed as a solicitation or an offer to buy or sell any securities or related financial instruments. Past performance is not a reliable indicator of future results. The performance shown does not take account of any commissions and costs charged when subscribing to and redeeming units. If whole or part of the total costs to be paid is different from your reference currency, the costs may increase or decrease as a result of currency and exchange rate fluctuations.
Commissions and costs have a negative impact on the investment and on the expected returns. If the currency of a financial product or financial service is different from your reference currency, the return can increase or decrease as a result of currency and exchange rate fluctuations. This information pays no regard to the specific or future investment objectives, financial or tax situation or particular needs of any specific recipient. Future performance is subject to taxation which depends on the personal situation of each investor and which may change in the future. The details and opinions contained in this document are provided by UBS without any guarantee or warranty and are for the recipient’s personal use and information purposes only. This document may not be reproduced, redistributed or republished for any purpose without the written permission of UBS Asset Management Switzerland AG or a local affiliated company. Source for all data and charts (if not indicated otherwise): UBS Asset Management.
This document contains statements that constitute “forward- looking statements”, including, but not limited to, statements relating to our future business development. While these forward-looking statements represent our judgments and future expectations concerning the development of our business, a number of risks, uncertainties and other important factors could cause actual developments and results to differ materially from our expectations.
UK: UBS Asset Management (UK) Ltd is authorized & regulated by the Financial Conduct Authority. Prospectuses, Key investor information (KIID), the articles of association or the management regulations as well as annual and semi-annual reports of UBS funds are available free of charge from UBS Asset Management (UK) Ltd, 5 Broadgate, London, EC2M 2QS. The fund documentation is available free of charge in English and, where relevant, in one of the local language(s) where the fund is registered and online at ubs.com/funds.
A summary of investor rights in English can be found online at: ubs.com/funds.
More explanations of financial terms can be found at ubs.com/glossary
© UBS 2022. The key symbol and UBS are among the registered and unregistered trademarks of UBS. All rights reserved.