Staying invested in the market regardless of which political party wins elections has been an effective strategy and one to consider when it comes to election years and beyond, according to new research from Charles Schwab.
The research covers the historical economic performance over the post-WWII period (since 1948), as well as stock market performance over the full span of the S&P 500 (since 1928). Looking at average gross domestic product (GDP) and personal consumption expenditures (PCE), both measures of growth have fared better when Democrats were in the White House.
Source: Charles Schwab, Bloomberg, as of 6/30/2024. PCE represents personal consumption expenditures.
Of the 14 recessions experienced by the U.S. economy in the post-WWII period, 12 started with Republicans in the White House and two started with Democrats in the White House. On the other side of that coin, recessions end, and of those 14 recessions, 10 ended under Republican presidents and four ended under Democratic presidents.
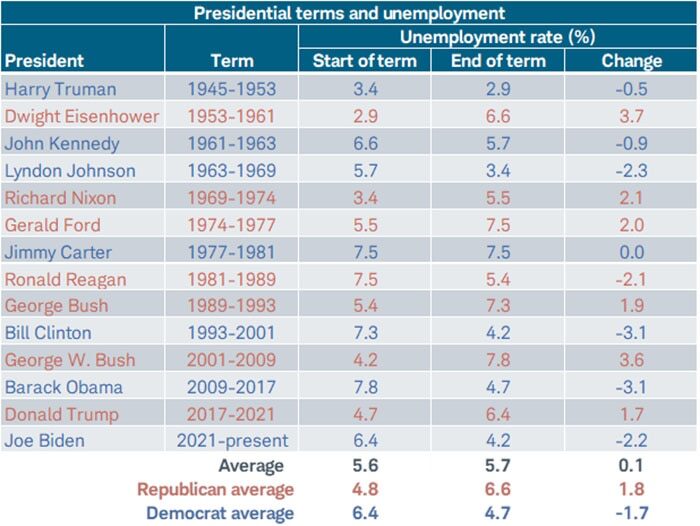
The unemployment rate started lower under Republican presidents than under Democrats on average. However, on average, the unemployment rate rose under Republicans and fell under Democrats. More specifically, the unemployment rate did not rise under any Democratic president during the post-WWII period, while it rose under all but one Republican president.

Source: Charles Schwab, Bloomberg, as of 8/31/2024. Data for Truman begins in 1948.
Presidential elections and the S&P 500
The table below shows stocks have performed better in all four cycle years under Democratic presidents. Regardless of the party in the White House, the pre-election year has historically been most rewarding for investors, with the strongest average returns and the highest percentage of positive outcomes. So far in this cycle, the market has to some extent been playing to form, with a weak 2022 (the mid-term year) and a strong 2023 (the pre-election year). However, somewhat uncharacteristically, the market this year (election year) has had a strong performance so far.

Source: Charles Schwab, Bloomberg, as of 12/31/2023.
Indexes are unmanaged, do not incur management fees, costs and expenses and cannot be invested in directly. Past performance is no guarantee of future results.
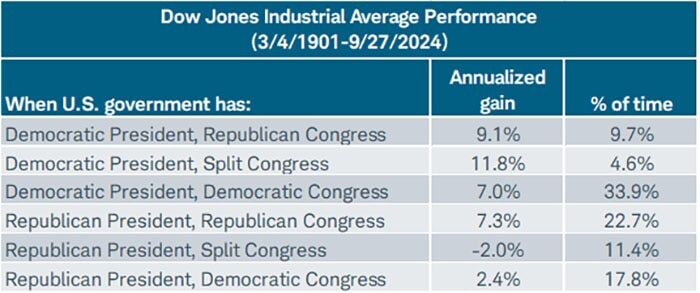
A separate study from Ned Davis Research, using the Dow Jones Industrial Average, which dates back to 1900, breaks down all six possible outcomes of US elections, beyond who controls the White House. As shown, the best performance historically was when a Democrat was in the White House, but Congress was split (also the best outcome in the post-WWII era). An important caveat is that that breakdown historically occurred less than 5% of the time. The next-best performance—with a much higher percentage of time—was when a Republican was in the White House and Republicans also controlled Congress. On the other side of the coin, the worst performance historically was when a Republican was in the White House alongside a split Congress.

Source: Charles Schwab, ©Copyright 2024 Ned Davis Research, Inc.
Further distribution prohibited without prior permission. All Rights Reserved. See NDR Disclaimer at www.ndr.com/copyright.html. For data vendor disclaimers refer to www.ndr.com/vendorinfo/. Indexes are unmanaged, do not incur management fees, costs and expenses and cannot be invested in directly. Past performance is no guarantee of future results.
Time IN the market
Using the post-WWII period, an investor who put $10,000 into the S&P 500 at the beginning of 1948 would have seen that grow to about $312,000 by the end of 2023 if the money was only in the market under Republican presidents. Conversely, $10,000 grew to more than $1.2 million by the end of last year when only invested under Democratic presidents. However, an investor who did not care whether the Oval Office was painted blue or red, and kept their money in the market, saw that initial investment grow to nearly $38 million.

Source: Schwab Center for Financial Research with data provided by Morningstar, Inc.
The above chart shows what a hypothetical portfolio value would be if an investor invested $10,000 in a portfolio that tracks the Ibbotson U.S. Large Stock Index on 1/1/1948 under three different scenarios. The first two scenarios are what would occur if an investor only invested when one particular party was president. The third scenario is what would occur if an investor had stayed invested throughout the entire period. Returns include reinvestment of dividends and interest. The example is hypothetical and provided for illustrative purposes only. It is not intended to represent a specific investment product. Indexes are unmanaged, do not incur management fees, costs and expenses and cannot be invested in directly. Past performance is no guarantee of future results.
Richard Flynn, UK Managing Director at Charles Schwab, said: “Analysis shows markets have tended to perform better under Democratic presidents than under Republicans – ignoring who is in control of the House and the Senate. However, while presidents are often quick to take credit for strong stock market performance or blame their predecessor for poor performance, history indicates they are likely responsible for neither. The US economy is a massive and complex system, and it is always difficult to tie any legislation directly to economic and market outcomes. The underlying macro and micro forces at work are much better explainers of stock prices and the trajectory of the economy. We have found that from a historical perspective, investors would tend to be better off if they stay in US markets, regardless of which party holds the White House.”
Charles Schwab’s investment platform enables UK investors to purchase US-listed equities with $0 commission for online trades, no service fees, and a $0 minimum to open an account. UK investors can buy and sell US equities, bonds, and options on the platform. As the platform is dollar-based, investors are also not required to pay currency conversion fees to buy US equities.


