Chart #4 – Stocks are still not cheap
The 12-month price to expected earnings ratio of the S&P 500 Index is 17.5. This multiple is below the 5-year average of 18.6 but above the 10-year average of 17.0. It is also higher than the ratio of 15.8 observed at the end of the second quarter. Since June 30, the S&P 500 Index has risen 9.7%, while 12-month earnings per share expectations have fallen 1.0%. The situation at the global level is similar: as the chart below shows, the long-term P/E of the MSCI World Index remains well above the 20-year average.
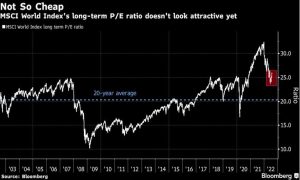
Chart #5 – A strong US employment report
Unemployment is low and wage gains are decent, despite an economy on the verge of recession and record inflation. The numbers released Friday are indeed surprising. The US economy added 528,000 jobs in July, more than double the estimates, while the US unemployment rate fell to a pre- pandemic low of 3.5%. Average hourly earnings rose 0.5% year-over-year, which also beats expectations.
In a way, the US economy has pulled off its biggest employment turnaround in history. As a result of the Covid-19 crisis, 22 million US jobs had been lost in March and April 2020. Since then, 22 million jobs were recreated, and the total number of employees reached a new high in July.
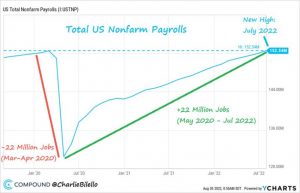
Chart #6 – Expectations for Fed rate hikes are on the rise again
Following the release of the US employment numbers, 2-year bond yields rose sharply and the market revised the rate hike expectations upward for this year (red line). Interestingly, the number of rate cuts expected for 2023 (green line) were also revised upwards.
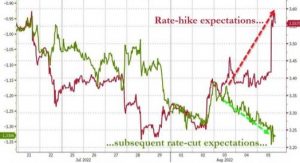
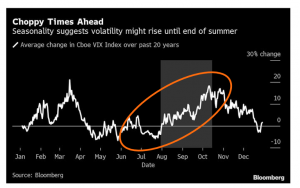
Chart #7 – Volatility tends to increase during the summer
As investors’ sentiment starts to improve, it would be good to remember that summer time does not always rhyme with calm for equity markets. Quite the contrary. In fact, an analysis of the behavior over the past 20 years of the VIX index (a measurement tool used to track the volatility of the S&P 500 index) shows that equity volatility tends to increase during the late summer and early fall. Among the explanations: this is the period when corporate executives and governments usually backtrack on their promises and goals from the beginning of the year (realizing that they cannot be met). It is also a time of the year when liquidity in the market tends to become thin as many stock market operators go on vacation.