AJ Bell has released its latest Dividend Dashboard report, showing dividend growth has slowed to a crawl since 2022, however upgrades mean analysts think 2026 will offer a new record-high total payment of £86 billion across the FTSE 100.
Russ Mould, AJ Bell investment director, has dug down into the data and shared his analysis into the dividend picture with us as follows:
“The FTSE 100 continues to outpace America’s Dow Jones Industrials and S&P 500 indices in 2025, as it stands near all-time highs of its own, despite nagging worries over the UK’s economic and political outlook, the absence of any real exposure to the theme of AI and gains in sterling, which dampen the value of overseas earnings and dividends in local currency terms.
“The prospect of lower interest rates from the Bank of England, signs of earnings forecast upgrades and ongoing attractive cash returns form the investment case for the FTSE 100, and UK equities more widely, where merger and acquisition activity continues to highlight the value which may still be on offer.
“Aggregate FTSE 100 dividend payments for 2025 are up slightly over the last three months, at £80.7 billion compared to £79.4 billion in September, although 2026 and 2027 estimates are, for choice, a fraction lower than in the autumn. However, further increases in the total distribution are required and analysts believe that 2018’s all-time high of £85.2 billion will finally be exceeded in each of 2026 and 2027, judging by aggregate FTSE 100 consensus estimates for dividend payments of £86 billion and £92.6 billion.
“Special dividends from Admiral, Sainsbury’s and Next come on top of ordinary dividends, as do planned share buybacks with a total value of £56.6 billion. The total cash return from the FTSE 100 is thus expected to be £138 billion in 2025, or 5.5% of the FTSE 100’s total £2.5 trillion stock market valuation. That cash yield beats inflation, the 10-year gilt yield and the Bank of England base rate which, on balance, still seems set to go lower before it goes higher once more.

Source: Company accounts, Marketscreener, consensus analysts’ forecasts. *Announced in aggregate as of 5 December 2025.
“Merger and acquisition activity also continues to top up the pot for investors, to perhaps emphasise the UK’s credentials as a source of value once more, at least in relative terms. A predator is yet to circle a FTSE 100 member in 2025, but buyers of UK assets have tabled bids worth a total of £29 billion already this year, after £49 billion-worth of successful approaches in 2024. Takeover deals can therefore also add to the total return from the UK equity market overall.
Profit forecasts show welcome resilience
“It is quite usual for analysts to start a year in an optimistic fashion and then trim back their forecasts as news flows. A gentle trickle of downgrades in the first nine months of the year suggested 2025 was about to stick to the script, but analysts have upgraded aggregate profit estimates for each of 2025, 2026 and 2027 in the fourth quarter of this year.
“The miners and the banks have been the biggest contributors to the upgrades, the former helped by rising industrial and precious metal prices, the latter by firm net interest margins and the absence of any major increase in sour loans.
“Analysts even think that 2026’s total for pre-tax profits could finally see the FTSE 100 exceed the record high of £231 billion recorded in 2022.
Source: Company accounts, Marketscreener, consensus analysts’ forecasts. Data as of 5 December 2025.
“Any further earnings forecast upgrades will help to underpin ordinary dividends, as well as any special payments and share buybacks, so this is a trend to follow.
Dividend growth still very concentrated
“For income-seekers, the FTSE 100’s yield may be a key part of the UK stock market’s appeal, but investors must be aware of how the forward yield is shrinking as the index makes gains and dividend payments gently decline.
“There also remains a fair degree of concentration risk within the UK’s headline index. Just 10 companies are forecast to pay out 54% of the forecast total for 2025, at £43.2 billion, while the top 20 are expected to chip in £56.8 billion, or 70% of the estimated total.
“The top 10 list includes two companies from each of the Oil, Pharmaceutical, Bank and Consumer Staples sectors, as well as one apiece from Mining and Utilities.
| 2025E | ||||
| Ten biggest forecast dividend payments | £ billion | Ten biggest forecast dividend increases | £ million | |
| HSBC | 9.2 | NatWest Group | 832 | |
| Shell | 6.3 | Fresnillo | 305 | |
| British American Tobacco | 5.2 | Rolls Royce | 239 | |
| Unilever | 3.8 | Lloyds | 199 | |
| BP | 3.8 | National Grid | 188 | |
| AstraZeneca | 3.8 | Unilever | 182 | |
| Rio Tinto | 3.5 | Aviva | 171 | |
| GSK | 2.6 | GSK | 132 | |
| NatWest Group | 2.6 | Admiral Group | 123 | |
| National Grid | 2.4 | SSE | 123 | |
Source: Company accounts, Marketscreener, consensus analysts’ forecasts. Ordinary dividends only. Data as of 5 December 2025.
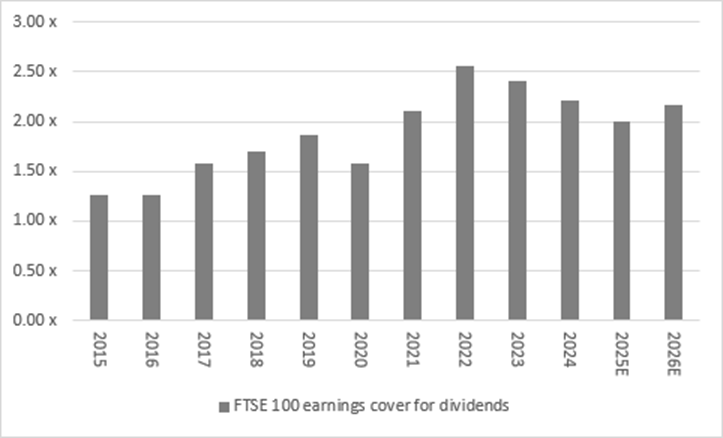
Dividend cover is still above two
“Those investors who are of a nervous disposition may look at the gradual decline in dividend cover across the FTSE 100. It reached a highly reassuring 2.55 times in 2022 but has since declined as companies have, in aggregate, increased dividend payments at a faster rate than their profits.
“For 2025, cover is – just – dipping below the 2.00 times mark, a figure traditionally seen as one that offers comfort and protection in the event of any unforeseen economic setback. At 1.99 times it still sits way higher than the lows of 2015-16 which did lead to a rash of dividend cuts, thanks to a mid-cycle growth bump, but the slide in earnings cover should be monitored. Thirteen FTSE 100 members cut their dividend in 2015 and a dozen more did so in 2016, figures only exceeded in the past two decades in 2009, at the end of the post-Global Financial Crisis recession, and the Covid-hit years of 2019 and 2020.
“The good news is that analysts’ earnings forecast upgrades for 2026 and 2027 mean cover exceeds the 2.00 times threshold for each of those years.
Source: Company accounts, Marketscreener, consensus analysts’ forecasts. Data as of 5 December 2025.
Many dividend yields compare well to gilts
“For the second quarter in a row, the life insurers Legal & General and Phoenix offer the highest forecast dividend yields within the FTSE 100. They are followed by asset management giant M&G (itself a spin-out from another life insurer, Prudential), and then two Real Estate Investment Trusts, in the shape of Land Securities and LondonMetric Property.
“Average earnings cover for the 10 highest forecast dividend payers in the FTSE 100 for 2025 does admittedly look skinny at just 1.22 times. Some of this is down to the vagaries of accounting in the insurance industry, which has four names in the top 10, since underlying cash flow is still strong, and some of it is down to the presence of three Real Estate Investment Trusts, where pay-out ratios must exceed 90% of stated earnings if their tax-advantaged status is to be maintained.
“Further reassurance can be drawn from how the 10 highest-yielding names represent just 13% of the overall forecast dividend pay-out, at £10.4 billion, and British American Tobacco represents half of that sum on its own.
“However, there have been 140 dividend cuts across the current crop of FTSE 100 members in the past decade and even if 73 of those came in the Covid-blighted years of 2019 and 2020 nothing can be taken for granted. WPP had already announced a cut for 2025, prior to its demotion to the FTSE 250 in December.
“Investors should therefore look at the balance sheet and cash flow statement– and not just the profit and loss account and earnings cover – when assessing how safe a dividend may be. They will also need to assess the volatility of profits and, in the case of cyclical stocks whose earnings and cash flow are subject to the vagaries of the economic cycle, look at average earnings over a full cycle to see what degree of cover that provides.
| 2025E | ||||
| Company | Dividend yield (%) | Dividend cover (x) | Pay-out ratio (%) | Cut in last decade? |
| Legal and General | 8.7% | 0.80 x | 126% | No |
| Phoenix Group | 7.9% | (0.40 x) | (248%) | 2016, 2018 |
| M & G | 7.2% | 1.25 x | 80% | No |
| Land Securities | 6.6% | 1.47 x | 68% | 2019 |
| LondonMetric Property | 6.6% | 1.56 x | 64% | 2015 |
| Admiral Group | 6.0% | 1.30 x | 77% | 2016, 2021, 2022 |
| Aviva | 6.0% | 1.26 x | 79% | 2019 |
| British Land | 5.6% | 2.41 x | 42% | No |
| British American Tobacco | 5.6% | 1.43 x | 70% | 2019, 2020 |
| Schroders | 5.6% | 1.13 x | 89% | No |
| AVERAGE | 6.6% | 1.22 x | 82% | |
Source: Company accounts, Marketscreener, consensus analysts’ forecasts, LSEG Refinitiv data. Based on ordinary dividends only. Data as of 5 December 2025.
“A further rule of thumb states that any dividend yield which exceeds the risk-free rate by a factor of two may turn out to be too good to be true. The 10-year gilt yield is a good proxy for the risk-free rate. A dozen years of interest rates at near zero rendered the rule pretty useless but now monetary policy is returning to something akin to ‘normal’ it may regain some of its former relevance.
“For the record, not one FTSE 100 stock currently offers a forecast dividend yield of 9.0% or more, or twice the 4.50% 10-year gilt yield that prevails at the time of writing, and that is probably no bad thing.
Serial dividend growers
“A really fat dividend yield is not necessarily a good sign anyway, as it can mean that investors are demanding such a juicy return to compensate themselves for what they see as substantial risks at a company, either in terms of its business model, balance sheet or boardroom acumen. The list of FTSE 100 firms which, on paper, were offering a 10%-plus dividend yield only to then deliver nothing of the sort as investors’ worst fears were realised is not a short one, and over the past decade it includes Centrica, Marks & Spencer, Shell, Imperial Brands, Persimmon and Vodafone.
“If anything, history suggests that it is dividend growth that is the real secret sauce for a share price, as a growing pay-out will drag it higher over time.
“Seventeen FTSE 100 members are nurturing an unbroken dividend streak of a decade or more. Severn Trent, Coca-Cola HBC and LondonMetric Property are closest to joining this elite grouping, with nine consecutive increases each.
“This grouping has, on average, provided premium capital returns and total returns relative to the FTSE 100. Twelve of the 17 have generated premium capital returns and 11 have done so in terms of total returns (including dividend reinvestment).
“However, the number of underperformers has increased in the past two to three years, as previously highly valued stocks such as Croda, Hikma and DCC have suffered a de-rating, to show that valuation really does matter in the end.
“Moreover, only nine of the 17 could be found in the FTSE 100 a decade ago. Any investor looking for the next generation of dividend growth winners may therefore need to dig into the FTSE 250 (or below).”
| Total return | Dividend CAGR | Dividend | Growth | ||
| 2015-25 | 2014-24 | 2025E | 2026E | ||
| 1 | Diploma | 781.3% | 13.3% | 5.1% | 4.7% |
| 2 | ICG | 476.2% | 14.2% | 6.8% | 6.0% |
| 3 | Ashtead | 431.5% | 18.3% | 3.6% | 10.9% |
| 4 | Halma | 374.7% | 6.8% | 12.2% | 7.5% |
| 5 | Scottish Mortgage | 308.2% | 4.1% | 8.4% | 5.3% |
| 6 | London Stock Exchange | 279.8% | 15.5% | 8.5% | 11.9% |
| 7 | F&C Investment Trust | 228.8% | 5.3% | 4.2% | 4.6% |
| 8 | RELX | 221.3% | 9.3% | 5.6% | 8.7% |
| 9 | Alliance Witan | 212.5% | 10.5% | 1.1% | 3.7% |
| 10 | Spirax Group | 160.3% | 9.8% | 3.8% | 6.0% |
| 11 | SEGRO | 120.2% | 6.9% | 5.9% | 6.6% |
| 12 | Sage | 119.5% | 5.4% | 6.8% | 7.0% |
| 13 | British American Tobacco | 118.2% | 4.8% | 1.0% | 2.1% |
| 14 | United Utilities | 101.0% | 3.2% | 3.3% | 2.8% |
| 15 | Croda | 24.9% | 5.3% | 1.7% | 3.9% |
| 16 | DCC | 11.0% | 10.4% | (1.9%) | 7.8% |
| 17 | Hikma Pharmaceuticals | (8.5%) | 16.7% | (1.4%) | 7.2% |
| AVERAGE | 233.0% | 9.4% | 4.0% | 5.2% | |
| FTSE 100 | 127.1% | 2.7% | 1.6% | 7.1% | |
Source: LSEG Refinitiv data, company accounts, Marketscreener, consensus analysts’ forecasts. Ordinary dividends only. Data to 5 December 2025.
DIVIDEND DASHBOARD EXPLAINED:
Each quarter, AJ Bell takes the forecasts for the FTSE 100 companies from all the leading City analysts and aggregates them to provide the dividend outlook for each company and the entire index. The data relates to the outlook for 2025, 2026 and 2027. Data correct as of 5 December 2025.