
As the fast-developing situation in the Middle East continues into its third week with no sign of immediate resolution, Guinness Global Investors’ Jonathan Waghorn (Portfolio Manager, Energy Team) provides an update on the company’s key observations as energy investors.
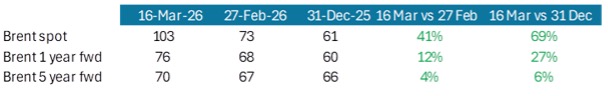
Oil markets have tightened sharply, with the Brent spot price rising to $103/bl (up 69% since the start of the year). Long-dated prices have moved only modestly, with 5-year forward Brent up by 6% since the start of the year.
The Strait of Hormuz remains effectively closed, severely restricting flows of oil and liquefied natural gas (LNG), which are normally 20m barrels a day and 11 billion cubic feet per day, respectively. Some mitigation exists via oil pipeline diversions and emergency releases of strategic petroleum reserves, but these add up to significantly less than 20m b/day.
If the Strait’s closure is prolonged, a material rationing of oil demand will be needed to balance the market. In this scenario, we see the oil price spiking well above $120/bl, to a level that induces significant demand destruction.
The loss of LNG (11 Bcf/day) through the Strait is comparable to c.75% of the amount of Russian gas Europe lost in 2022. Meanwhile, Price spikes have been strongest in oil products (versus crude oil), reflecting tighter pre-existing balances and low inventories. Aviation fuel and naphtha prices (used for petrochemicals) have seen particularly violent price increases.
The conflict is raising the near-term oil prices used to value oil and gas equities. Assuming $80/bl Brent oil for 2026, versus a prior forecast of $65/bl, we see earnings for the Guinness Global Energy portfolio increasing by around 50%.
However long it lasts, the conflict is likely to have implications for energy markets beyond 2026. The severity of disruptions raises doubts about the reliability of Middle Eastern supply and may require higher oil prices to incentivise capacity growth elsewhere. Also, the rebuilding of strategic oil reserves post conflict will increase demand.
Observation 1: Shifts in the oil futures curve
Looking at the moves in spot, 1-year forward and 5-year forward Brent oil prices in dollars per barrel:
The following chart shows the oil futures curve today (in white), versus the end of February (in purple) and at the start of 2026 (in blue):
Oil futures curve: Brent ($/bl)
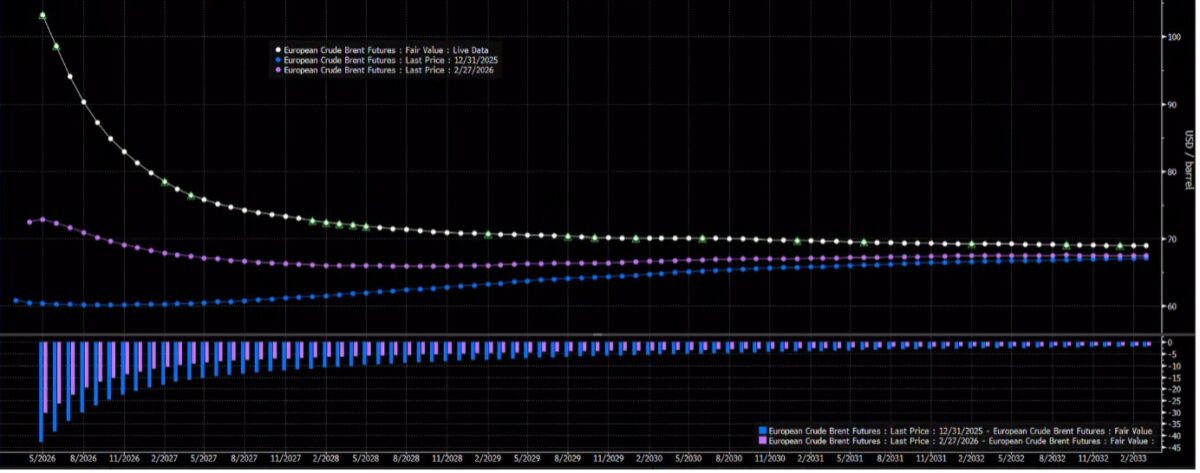
As can be seen, the Brent futures curve has moved sharply into backwardation, with the spot price now $27/bl higher than the 1-year forward price. This compares to the start of the year when the curve was in slight contango (meaning the spot was lower than most of the rest of the forward curve).
The 5-year forward price has seen a much more muted response: up 4% since the start of the conflict and up 6% year-to-date.
Observation 2: Impact from blockages in the Strait of Hormuz
The Strait typically sees the daily passage of around 20m barrels of oil/oil product and around 10-11 Bcf of LNG, with a total of around 35 tankers passing through in each direction. This remains the key constraint and, since the start of the war, an average of around 2 tankers (half of which have been Iranian tankers) have been passing through the Strait.
The Strait remains essentially closed.
Number of daily transits through the Strait of Hormuz
In terms of oil:
At the start of March, we believe there was around 4m b/day of spare pipeline capacity that could be used to divert oil that otherwise would be flowing through the Strait. Most of this spare capacity sits in Saudi’s East-West pipeline to Yanbu. Pipeline data from the last seven days already shows a sharp increase in flows, up by around 2-2.5m b/day, implying a further 1.5-2m b/day to be utilised.
While difficult to quantify, we believe that key Gulf producers held around 100m barrels of spare storage capacity at the start of the war. Recent oil company announcements and data from Petro-Logistics, an energy data provider, suggests that this spare storage capacity is essentially used up and that further production shut-ins are imminent. Currently, according to Rystad, oil production of over 8m b/day and refining capacity of over 2m b/day is currently shut in ‘behind the Strait’.
President Trump has mentioned the use of a convoy system to defend tankers through the Strait. A comparable effort was last seen for two months in 1987-1988 under Operation “Earnest Will”, when the US helped to escort Kuwaiti tankers through the Strait. However, the protection was for Kuwaiti tankers only, came in small convoys and was carried out only once every few days. This time, a daily effort will likely be needed to protect all tankers, and since the late 1980s the volume of oil and (especially) LNG passing through the Strait has greatly increased.
In terms of natural gas:
The largest producer, QatarEnergies, has shut in LNG production and it is unlikely that LNG supplies will restart for at least two weeks, since it takes that time frame to ramp facilities back up to full production. The loss of 10-11 Bcf/day of LNG is equivalent to the loss of around 75% of the Russian pipeline gas lost by Europe in 2022.
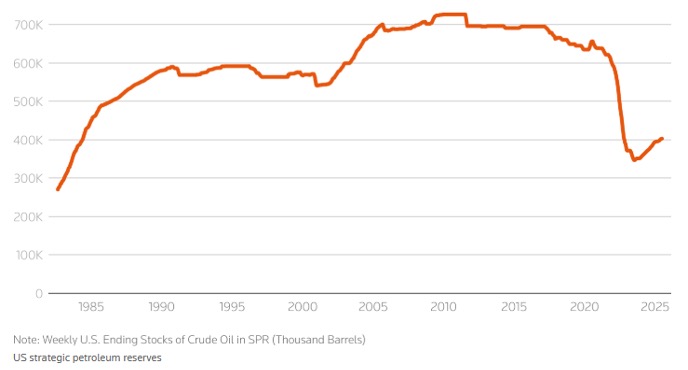
Observation 3: IEA strategic oil inventory being released
Last week, the International Energy Agency (IEA) announced the release of 400m barrels of its member countries’ strategic oil and oil product inventory, the largest ever release.
Total capacity is around 1,500m barrels (defined as being a minimum of 90 days’ coverage of member country oil imports) while the US Strategic Petroleum Reserve is around 400m barrels (around 200 days of coverage of US net imports of crude oil).
While strategic inventories are large in volume, the key variable is the amount of oil that can flow daily from them. The most recent use of the IEA’s strategic inventories was after the Russian invasion of Ukraine in 2022 – then the biggest planned strategic stockpile release in oil market history. Over a period of around six months, the US released around 180m barrels, whilst the rest of the IEA released around 100m barrels. Combined, these strategic releases provided around 1.5m b/day of oil into the market.
US strategic petroleum reserves
There is also the question of what China might do. China has its own strategic oil reserve, which it has been building energetically since the start of 2025. The build over the last 12 months is thought be around 200m barrels. Flow rates from China’s reserves are unknown, but we would guess similar to the IEA.
Even allowing for the pipeline diversions and strategic inventory releases described, a prolonged closure of the Strait leaves a supply shocks far in excess of that contemplated by the market during the Russian invasion of Ukraine in 2022. And it would be a supply shock that can only be solved by physical rationing (i.e. demand destruction).
Observation 4: Price reactions greatest in oil products and natural gas
Those energy commodity markets that were facing the tightest supply/demand outlook or had the lowest inventories have typically seen the greatest price increases over the last two weeks. Most notable have been:
Global oil product prices, where we have seen increases of over 100% for Asian jet fuel, for example. Before the war, oil product markets were generally tighter, with lower inventories than crude oil markets, which were forecast to be oversupplied with ample inventory. Jet fuel is also more difficult to store than crude oil. In retail terms, US retail gasoline prices have risen from $2.80/gallon at the start of the year to over $3.70/gallon today. As summer brings the US driving season, this will become an increasingly important metric.
European and Asian natural gas where prices have increased by between 70% and 100% year-to-date. Both regions rely on LNG imports so prices have risen as each competes for LNG. Price movements are exacerbated because i) LNG and natural gas are both difficult and expensive to store ii) the major supply source has been shut down and there is no replacement route for exporting LNG and iii) European gas inventories were already at very low levels going into the summer refill season.
Observation 5: Moving towards an oil price that causes demand destruction)
We typically refer to Brent oil prices when we refer to the ‘global’ oil price. Brent crude oil (a light sweet crude oil) is not the same as the Middle Eastern crude (typically a medium sour grade) that has been lost from the market. On this occasion, the nearest comparable crude to the lost Middle Eastern volumes is Omani crude oil, which is currently freely available since its export route does not include the Strait of Hormuz. Omani crude oil has historically traded in line with Brent but it is now being priced at more than $145/bl, reflecting the physical rationing of oil that has started for Asian refiners.
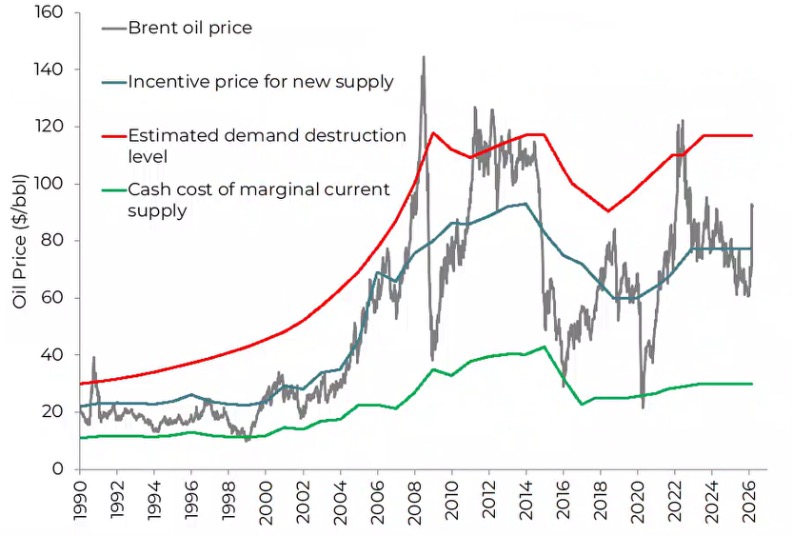
If the Strait of Hormuz remains closed, the oil market needs to find a price that incentivises the shut-in of a material amount of demand. This would require a price well in excess of the current level ($105/bl), and also well north of our ‘demand destruction’ level of $120/bl, as this is simply a price that starts to cause more serious demand ‘pain’.
Observation 6: near-term commodity and equity implications
The Iran conflict has raised near-term oil prices (and near-term oil price estimates) and they will have a positive knock-on effect for global and gas company earnings in 2026.
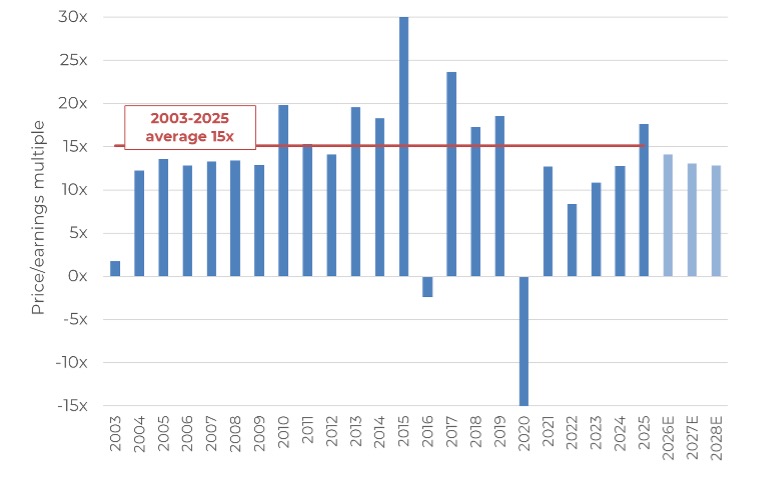
Running an $80/bl Brent oil price scenario for the fund’s holdings in 2026 would see earnings-per-share increases for producing companies of around 30-70% (versus our prior forecasts which assumed $65/oil). In this scenario, the fund’s total earnings per share rise by around 50%. This brings the fund’s price/earnings (P/E) multiple down to around 14x in 2026, which compares to the long-run average P/E of around 15x and the current MSCI World P/E of around 20x for 2026.
P/E multiples for key holdings in the Guinness Global Energy Fund
Observation 7: Longer-term commodity and equity implications
However things play out in the short term, recent events are also likely to have an impact on the outlook for energy commodities and energy equity valuations beyond 2026:
On the supply side, even when the Strait has reopened, the perceived reliability of Middle Eastern capacity is likely to remain in question until confidence in secure export routes is achieved. There are also examples in the industry (for example Kuwait in the 1990s) where disruption to existing production has resulted in lower oil recoveries from those wells in the future. Whether this comes to pass will depend on the size and the duration of the shut-in.
Should confidence in Middle Eastern oil not fully return, then higher oil prices (think $80/bl Brent and above) are likely to be required to incentivise the oil industry to deliver growth from elsewhere, such as US shale or Venezuela.
On the demand side, strategic inventories of oil and oil products have come sharply back into focus. Not only will consuming countries need to rebuild any oil taken out of strategic inventory, but there is also greater likelihood that oil-importing countries choose to build greater strategic inventory buffers. This will create additional demand.
In terms of commodity prices, there is likely to be a premium paid for non-Middle Eastern barrels (typically where the fund’s portfolio companies produce their oil and natural gas) as well as a likely higher geopolitical premium, depending upon the ultimate outcome of the war.
Accordingly, we see an increased likelihood that the market prices a higher oil price into the valuation of energy equities than before the conflict began.
Markets on edge? Why diversification is your first line of defence.
Get expert guidance on MPS construction, asset allocation, and portfolio design by downloading IFA Magazine’s latest MPS Insights Publication and earn CPD HERE.