In January 2026, gold posted its largest monthly gain since September 1999, before recording its sharpest monthly decline since June 2013 in March 2026. The first quarter of 2026 has therefore been exceptionally eventful for the metal. Nitesh Shah, Head of Commodities and Macroeconomic Research, WisdomTree, shares his thoughts.
We believe gold is in the process of transitioning towards a new, higher steady state, driven by a broadening investor base. Chinese insurance companies, Indian pension funds, and digital asset issuers such as Tether represent relatively new sources of demand. At the same time, gold exchange-traded fund (ETF) inflows in both China and India have increased significantly over the past year.
The process of establishing this new equilibrium is likely to remain volatile. However, it also suggests that gold prices may ultimately settle at a higher level. For long-term investors, periods of volatility may therefore present opportunities rather than risks.
Against this backdrop, modelling gold prices is particularly challenging. We therefore treat forecasts derived from our traditional framework as a baseline, with potential upside driven by structural shifts in demand, alongside an expectation of elevated volatility.
Gold’s volatility challenges the modelling framework
When we wrote our Gold Outlook to Q4 2026 back in January 2026, we used our WisdomTree proprietary gold model with some trepidation. As we outlined at the time, we were concerned that gold may be leaving its prior steady state, with new structural forces driving it to a higher equilibrium. A model calibrated over the period 1995 to 2023, a relatively calm era for gold, may not have experienced a disruption of this scale before.
However, in the absence of an alternative, well-tested framework, we decided to retain our model rather than hastily introduce adjustments that may simply reflect short-term, narrative-driven dynamics[1].
An unprecedented start to 2026
Little did we know that, shortly after sending the Q4 2026 draft for publication, gold would embark on one of the most volatile episodes in its modern history. In January 2026 alone, gold gained more than US$1,000 per ounce on an intraday basis, reaching an all-time high of nearly US$5,600/oz on 30 January 2026. This move reversed sharply, with prices falling to an intraday low of US$4,402/oz by 2 February 2026. In effect, the gains accumulated over January were erased within a matter of days.
By 23 March, gold had declined further to around US$4,100/oz, marking a year-to-date loss. Yet within a week, prices rebounded above US$4,600/oz, once again illustrating gold’s capacity for rapid recovery. We have rarely observed such pronounced volatility in the gold market as in Q1 2026.
Rethinking the role of models
What is happening in gold markets continues to challenge the appropriateness of a purely model-based forecasting approach. We are actively experimenting with enhancements to incorporate more sophisticated elements. However, we do not yet have a framework we are sufficiently confident in to deploy. Indeed, many approaches struggle to adequately capture the recent behaviour of gold.
Our research into new modelling techniques continues and is yielding promising insights. In the interim, we will continue to draw directional cues from the existing model. However, a key caveat is that we will no longer rely on it for short-term (quarterly) forecasts. Our experience in Q1 2026 demonstrates that such precision is likely illusory. Instead, we will focus on a one-year horizon.
Geopolitical shocks and amplified market reactions
A key driver of gold’s sharp volatility in Q1 2026 was the sequence of back-to-back geopolitical shocks. These included regime change in Venezuela in early January, renewed discussions around the potential acquisition of Greenland by the United States and continued political pressure on Federal Reserve (Fed) independence.
These events should, in principle, have been supportive for gold, and indeed they were, but the magnitude of the initial move appears to have been excessive. As discussed in our previous outlook, the pool of gold buyers has expanded significantly in recent years, potentially amplifying initial price reactions. Many of these ‘amplification agents’ are increasingly located in China and India, where gold demand has been particularly strong.
A necessary correction?
At the same time, several offsetting forces emerged. The nomination of Kevin Warsh as a candidate for Fed Chair reduced concerns that political influence over monetary policy would intensify. Seasonal dynamics may also have played a role, with Asian demand cooling following strong pre-Lunar New Year buying. In addition, central bank purchases likely slowed as prices became increasingly stretched.
In hindsight, the February correction appears both inevitable and, arguably, necessary following January’s sharp rally.
When geopolitics does not immediately support gold
A geopolitical development that, in our view, should have had a more sustained positive impact on gold was the outbreak of the United States/Israel–Iran conflict in February 2026. However, this occurred at a time when gold was already undergoing a correction.
Moreover, geopolitical shocks do not always lead to an immediate rise in gold prices.
Stress selling and the ‘down-then-up’ pattern
It is important to recognise that gold often exhibits an initial negative reaction to geopolitical shocks before ultimately rising. This pattern has been observed across multiple historical episodes, including the 9/11 terrorist attacks, the dot-com bubble, Black Monday in 1987, and the Russia–Ukraine war (see figure below).
The mechanics are relatively consistent. A geopolitical shock tends to trigger sharp declines in risk assets such as equities. This, in turn, generates margin calls, forcing investors to raise liquidity quickly. Gold, as a highly liquid and cash-like asset, is often sold to meet these obligations. This creates temporary downward pressure on prices. It’s important to note that the amplitude and duration of the drawdown and subsequent recovery are never the same and clearly depend on what else is influencing gold at the time.
In the current episode, additional selling pressure may also have emerged from households in affected regions, particularly in the Middle East, where gold has been liquidated to fund urgent expenditures such as travel and relocation.
Crucially, this type of selling should not be interpreted as a loss of confidence in gold. Rather, it reflects gold’s role as a source of liquidity in times of stress. Historically, once these forced-selling dynamics subside, gold prices tend to recover and move higher as the underlying geopolitical risk premium becomes the dominant driver.
Figure 1: Gold price performance after geopolitical events
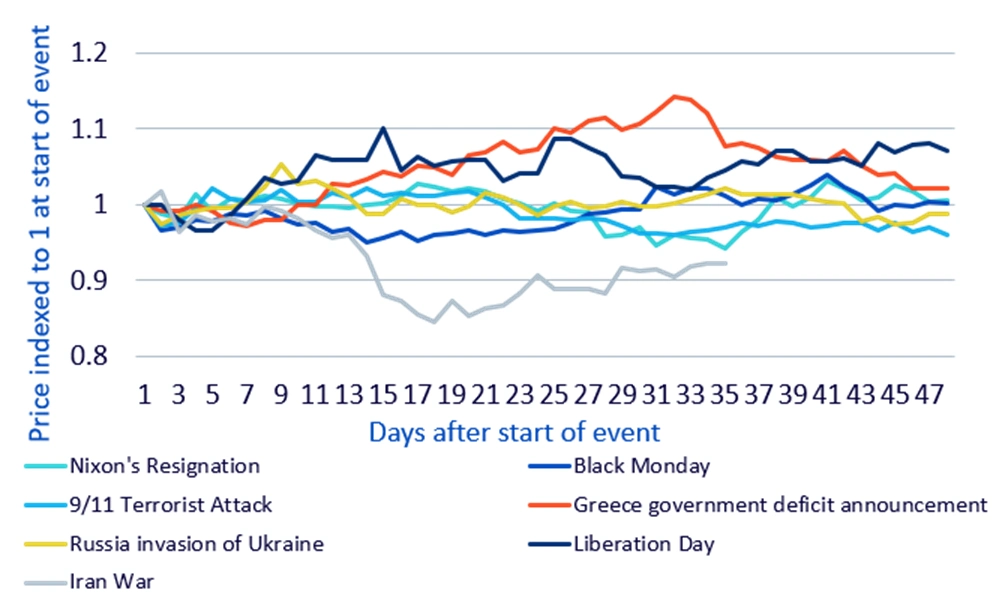
Source: Bloomberg Finance L.P, WisdomTree, 1974-2026. Historical performance is not an indication of future performance, and any investments may go down in value.
An emerging inflection point
By late March 2026, we believe an inflection point was reached, with gold beginning to trend higher once again. Notably, this recovery has occurred despite several traditional headwinds: a stronger US dollar (US$), elevated bond yields, and a shift in expectations away from interest rate cuts by the Fed, alongside rate hikes from the European Central Bank (ECB) and the Bank of England (BoE).
If gold is able to rise in the face of these headwinds, it suggests the presence of a strong underlying tailwind, most likely elevated geopolitical risk.
A breakdown in traditional sentiment indicators
Once again, these developments present challenges for our modelling framework. Traditionally, we use net speculative positioning in COMEX gold futures as a proxy for investor sentiment. Historically, geopolitical concerns have been a driver of investor sentiment towards gold and hence have driven up net speculative position in the gold futures. However, net positioning in recent months has appeared subdued and below average, clearly not reflecting the prevailing geopolitical concerns. This calls for a wider measure of geopolitical risks and sentiment. But finding the right measure has so far proven difficult.
Figure 2: Net speculative positioning in gold futures
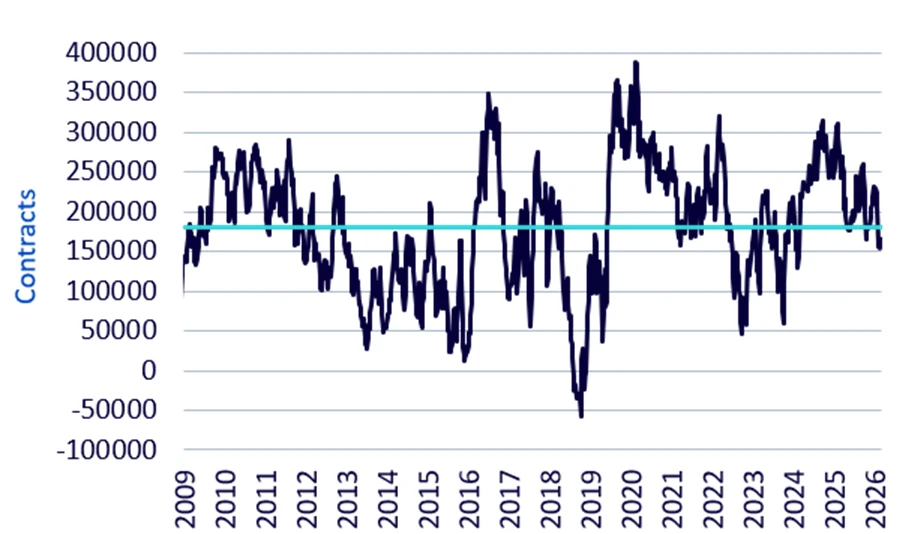
Source: Bloomberg Finance L.P, WisdomTree, January 2009 – April 2026. Historical performance is not an indication of future performance, and any investments may go down in value.
We have explored incorporating a geopolitical risk index into our models[2]. However, as a non-stationary variable, it is difficult to justify statistically. Treating it as an exogenous shock can improve model fit (as measured by root mean squared error), but its practical usefulness is limited given the unpredictability of geopolitical events.
Limits of existing data and the case for adaptation
Furthermore, net speculative positioning is derived from Chicago Mercantile Exchange Commodity Exchange (CME COMEX) data, which may be overly US-centric. Expanding the framework to include Shanghai Futures Exchange (SHFE), over-the-counter (OTC) markets, and exchange-traded product (ETP) flows could provide a more comprehensive view. However, this would reduce the length of the available historical dataset, limiting our ability to model across multiple economic cycles.
For now, we retain the existing model, while applying judgement-based adjustments to speculative positioning assumptions to better reflect the broader global picture.
Geopolitical risk: From catalyst to structural support
If the Iran conflict has transitioned from being a source of gold liquidation to a driver of geopolitical risk premium, the key question becomes: when will that risk dissipate?
At the time of writing, the answer remains highly uncertain. Repeated deadline extensions and shifting red lines suggest that while full-scale escalation has been avoided, meaningful de-escalation has also not materialised.
As this is a mid-term election year in the United States, we believe there may be an incentive for President Trump to seek an off-ramp that allows for a declaration of success. However, such an outcome may leave structural tensions unresolved, particularly around the Strait of Hormuz, resulting in a persistently elevated level of geopolitical risk.
In our view, this implies that geopolitical risk is likely to remain a supportive factor for gold over the coming year.
Central bank independence remains in focus
There are multiple sources of uncertainty that we believe will continue to underpin gold prices.
In previous outlooks, we highlighted concerns around central bank independence. The primary concern has been President Trump’s numerous attacks on the Fed and worries that he will install a team of partial Governors (like Stephen Miran, who joined the Federal Reserve Board of Governors in September 2025).
An update is warranted.
The nomination of Kevin Warsh in late January 2026 has reduced concerns about political interference in Federal Reserve policy. The recent news whereby the Department of Justice is ending its criminal probe of current Fed Chair Powell now puts Warsh’s nomination on a clearer glidepath for confirmation. Indeed, Senator Thom Tillis has indicated he will no longer ‘block’ the nomination process and will support Warsh for the Fed Chair position.
Barring any unforeseen circumstances, it would appear that Kevin Warsh will more than likely be the Fed Chair when the Federal Open Market Committee (FOMC) next meets on 17 June. However, there is still some uncertainty as to whether Powell will remain a Fed governor going forward, and whether President Trump will have another opportunity to nominate another Fed governor in the future. We believe that gold will remain supported in times of uncertainty.
Legal uncertainty around federal reserve governance
Meanwhile, legal challenges continue. Lower courts have blocked attempts to remove Federal Reserve Governor Lisa Cook, but the United States Supreme Court has yet to issue a final ruling. Oral arguments were heard in January 2026, with a decision expected by mid-year.
Fiscal pressures and bond market signals
Fiscal dynamics also remain a concern. Following the Supreme Court’s ruling against the use of the International Emergency Economic Powers Act (IEEPA) for tariffs on 20 February 2026, tariff revenues are likely to fall short of expectations. Combined with tax cuts, increased fiscal spending, and rising military expenditures, this points to a widening US deficit.
Recent US Treasury auctions showed softer demand in late March, but early April auctions saw demand re-emerge at higher yield levels. Given the uncertain backdrop, it is possible that investors could require concessions to absorb elevated supply. This continues to point to a higher term premium backdrop, and we do not foresee any disorderly loss of demand. In such an environment, gold may remain well supported given its finite supply. The historically inverse relationship between gold and bond yields may therefore continue to weaken, as observed in recent years.
Non-traditional demand: The role of digital asset issuers
Tether, which we previously identified as a significant gold buyer, has yet to release its Q1 2026 attestation report. However, its Q4 2025 report confirms a strong accumulation trend. We estimate that Tether purchased between 60 and 70 tonnes of gold during 2025, placing it alongside some of the largest official-sector buyers, including Kazakhstan, the State Oil Fund of the Republic of Azerbaijan (SOFAZ), Brazil, and Turkey.
A key caveat is that International Financial Statistics (IFS) data is known to underreport central bank activity. For example, China reported only 27 tonnes of purchases in 2025, which likely understates actual buying. In aggregate, central bank purchases may be three to four times higher than reported figures.
Figure 3: Estimated Tether Quarterly Gold Purchases (2025)
| Quarter | Estimated gold purchases (tonnes) | Comment |
| Q1 2025 | ~8–12t | Early stage, smaller balance sheet |
| Q2 2025 | ~12–16t | Scaling with issuance |
| Q3 2025 | 26t | Acceleration starts |
| Q4 2025 | 27t | Peak flow |
Source: WisdomTree estimates based on Tether quarterly attestation reports and LBMA gold price.
Historical performance is not an indication of future performance, and any investments may go down in value.
Gold as a source of liquidity in times of stress
It is not only investors who sell gold in times of stress to raise liquidity, central banks can behave similarly. Turkey provides a clear example. In order to support the Turkish lira, the central bank sold (and in some cases swapped) gold to obtain US dollar liquidity.
The scale and speed were notable: approximately 58–60 tonnes were mobilised within a two-week period. Importantly, a portion of this activity involved gold swaps rather than outright sales, effectively collateralised foreign exchange (FX) intervention, where gold remains on the balance sheet.
While such actions may initially appear negative for gold prices, we interpret them differently. They reinforce gold’s role as a highly liquid, trusted reserve asset. Both investors and central banks turn to gold in times of stress, not as a rejection of the asset, but as validation of its utility.
Historical precedent supports this view. Following significant gold sales in 2023 to stabilise domestic markets after an earthquake, Turkey subsequently rebuilt its gold reserves over the following months. We expect a similar pattern to emerge over time.
Gold forecasts
Forecasting gold prices using a model-based approach is exceptionally challenging at present. While we are exploring enhancements to our existing framework[3], we may not find a single solution capable of fully capturing the current level of volatility. We believe a new steady state could eventually emerge, but during this period of transition, uncertainty is unavoidable.
We therefore present below a one-year-ahead forecast for gold prices based on our existing model. We deliberately avoid presenting intra-period (quarterly) projections, given the extreme volatility observed in Q1 2026.
These forecasts should be interpreted as the lower bound of a plausible range, driven by traditional macroeconomic variables. Additional upside may arise from a shift in the steady state itself, potentially driven by broader investor participation.
Consensus scenario
In addition to model uncertainty, macroeconomic uncertainty remains elevated. Bloomberg’s survey of professional economists was conducted at the end of March, during a period when market sentiment was oscillating rapidly between escalation and de-escalation of geopolitical risks.
Federal funds futures shifted from pricing in rate cuts to a prolonged pause, and then back to partial cuts, within a matter of days. While professional forecasters may exhibit more stability than market-implied indicators, the dispersion of their views has widened. Moreover, many forecasts are still in the early stages of adjustment to the evolving macroeconomic environment. Anecdotally, we have observed forecasters revising projections aggressively, only to reverse course shortly thereafter.
Nevertheless, based on consensus expectations for inflation, bond yields, and the US dollar (US$), gold is projected to rise towards US$5,500/oz over the coming year. This would effectively mark a new high on a closing-price basis, given that the intraday peak of US$5,600/oz in January 2026 was only briefly sustained.
Inflationary pressures remain elevated, driven by the Iran conflict, fiscal expansion in the United States and Europe, and ongoing tariff-related disruptions to supply chains. While tariffs under the International Emergency Economic Powers Act (IEEPA) have been curtailed, alternative measures, such as Section 122 tariffs, continue to exert upward pressure on prices.
Yields on 10-year US Treasuries have already risen materially since the onset of the conflict. On average, forecasters do not expect significant further increases from current levels. Meanwhile, the US dollar has appreciated due to its safe-haven status and the United States’ position as a net energy exporter. However, structural forces, including widening twin deficits, are expected to reassert themselves, leading to gradual depreciation. Notably, this depreciation is expected to be modest, returning the US dollar index (DXY) to levels seen in January 2026 rather than significantly below.
We increase net speculative positioning in gold futures to 200,000 contracts, up from approximately 160,000 at the time of writing. This is broadly in line with long-term averages. Current positioning appears relatively subdued given the geopolitical backdrop, suggesting that Chicago Mercantile Exchange Commodity Exchange (CME COMEX) data may only provide a partial view of global sentiment.
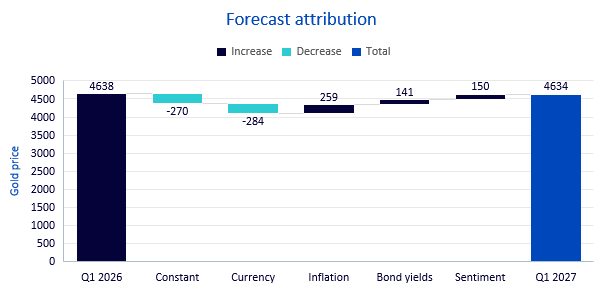
Overall, the model attribution indicates that improving sentiment and elevated inflation are the primary drivers of gold’s projected upside in this scenario.
| Consensus | Q1 2027 |
| Inflation forecast | 2.8% |
| Nominal 10-year yields forecast | 4.13% |
| US$ exchange rate forecast (DXY) | 96.3 |
| Speculative positioning forecast | 200,000 |
| Gold price forecast (US$/oz) | 5,493 |
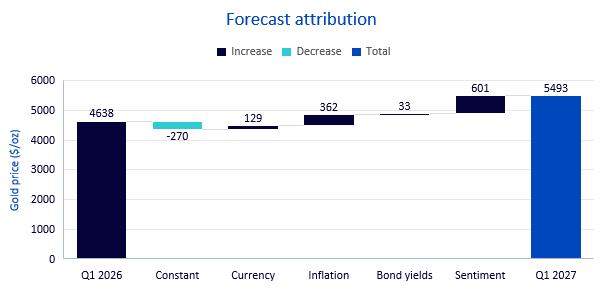
Source: WisdomTree. Bloomberg Survey of Professional Economists. March 2026. Forecasts are not an indicator of future performance, and any investments are subject to risks and uncertainties.
Bull scenario
In the bull scenario, inflation jumps to 4% reflecting the energy crisis and other supply chain pressures.
Even if the Fed is reluctant to tighten policy, recognising that price increases are being driven by supply-side pressures, bond yields are still likely to rise.
At the same time, US dollar depreciation would be more pronounced than in the consensus scenario. While the consensus scenario assumes a return to January 2026 levels, the bull scenario envisages a further decline of approximately 7% in the DXY.
If inflation rises towards 4% while the Fed refrains from tightening policy, the central bank may face accusations of policy error or political capitulation. In such a scenario, gold sentiment is likely to strengthen significantly, as the metal is increasingly viewed as a hedge against fiat currency debasement.
| Bull | Q1 2027 |
| Inflation forecast | 4.0% |
| Nominal 10-year yields forecast | 5.0% |
| US$ exchange rate forecast (DXY) | 90 |
| Speculative positioning forecast | 250,000 |
| Gold price forecast (US$/oz) | 5,872 |
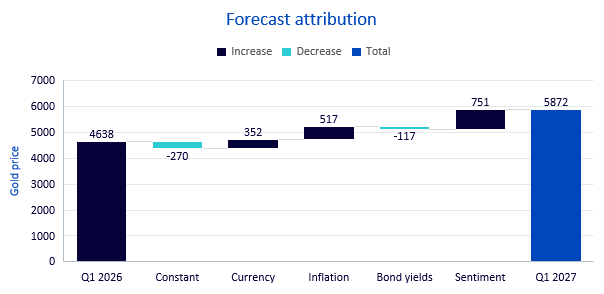
Source: WisdomTree. March 2026. Forecasts are not an indicator of future performance, and any investments are subject to risks and uncertainties.
Bear scenario
In the bear case, the Federal Reserve successfully brings inflation back to its 2% target, a level not achieved in recent years, but at the cost of weaker economic growth.
Higher policy rates drive a significant appreciation in the US dollar, reversing much of the depreciation observed in 2025. While we view this scenario as the least likely, it cannot be ruled out. A central bank seeking to demonstrate its independence may adopt a more forceful stance than currently anticipated.
The lower inflation environment will support bond yields declining to 3.5%.
Under this scenario, gold prices decline towards the US$4,600–4,650/oz range, broadly returning to levels observed at the start of 2026.
| Bear | Q1 2027 |
| Inflation forecast | 2.0% |
| Nominal 10-year yields forecast | 3.5% |
| US$ exchange rate forecast (DXY) | 108 |
| Speculative positioning forecast | 50,000 |
| Gold price forecast (US$/oz) | 4,634 |
Source: WisdomTree. March 2026. Forecasts are not an indicator of future performance, and any investments are subject to risks and uncertainties.
Conclusion
Gold has experienced a highly volatile start to 2026. The expansion of the investor base is likely contributing to a transition towards a higher steady state. Disentangling price movements driven by traditional macroeconomic factors from those driven by this broader participation remains challenging.
While we continue to refine our modelling approach, it is possible that no framework will fully capture this transition until a new equilibrium has been established. In the meantime, we retain the core model to provide a baseline for how traditional drivers may influence gold prices.
Accordingly, we interpret our forecasts as representing the lower bound of a plausible range, with additional upside potential arising from continued expansion in the investor base.
Even under the consensus scenario, gold prices return to all-time highs on a closing basis, surpassing previous peaks once the short-lived intraday spike in January 2026 is excluded.
[1] Specifically, we stated: ‘Periods of regime transition are, by definition, the most challenging environments in which to recalibrate quantitative models. While it is tempting to respond to apparent shifts by redesigning models ex post, doing so risks embedding transient dynamics or narrative-driven assumptions that may not persist. At present, there is no clear empirical basis for defining the parameters of a new steady state, nor for determining which historical analogues should anchor such a framework.’ WisdomTree Gold Outlook to Q4 2026: Into uncharted territory, January 2026.
2 Caldara, Dario and Matteo Iacoviello (2022), Measuring Geopolitical Risk.
3 See The investment case for gold for a description of our model approach.